UPI transactions for groceries and supermarkets increased from around ₹60,074 crore in April to ₹64,882 crore in July in terms of value.
Debt-related transactions via UPI increased from ₹80,788.65 crore in April this year to ₹93,857.47 crore in July.
Utilities-related transactions like electricity, gas, water, and sanitation via UPI increased from ₹18,060.74 crore in April to ₹23,497.63 crore in July.
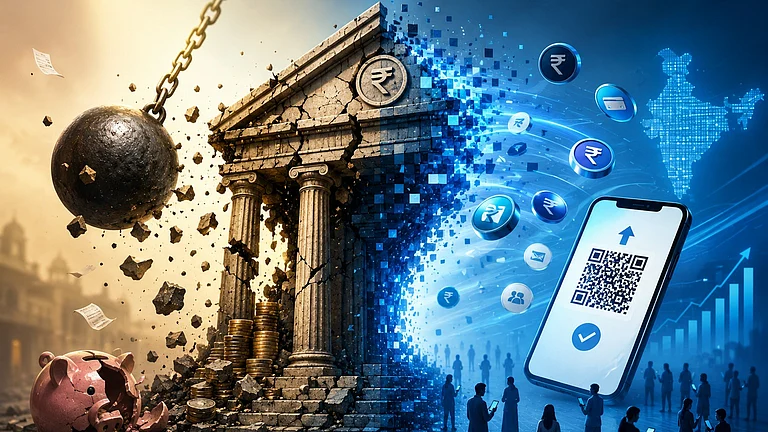
Unified payments interface (UPI) has become the heartbeat of Indian households—fueling the rhythm of daily life by powering grocery runs and supermarket checkouts, making essential shopping as effortless as a few clicks on the screen. But these are not the top heads under which Indians are making the most payments.
Apart from groceries and supermarkets, other categories where UPI is ruling customer preference are debt collection agencies and service station-related spending, a recently released data by the National Payments Corporation of India (NPCI) showed.
1 June 2026
Get the latest issue of Outlook Business

While payments made via UPI platforms for groceries and supermarkets topped the list in terms of volume of transactions between April and July, 2025, transactions related to debt payments topped in value terms during the same period. It increased from around ₹60,074 crore in April to ₹64,882 crore in July in terms of value. The overall volume of transactions surged from 269.903 crore in April to 303.259 crore in July.
NPCI’s data revealed that the value of debt-related transactions via UPI increased significantly from ₹80,788.65 crore in April this year to ₹93,857.47 crore in July. The volume of transactions in the segment also witnessed an increase from 13.574 crore in April to 16.136 crore in July.
Meanwhile, service station-related expenditure, which accounted for the third-highest category of UPI payments, witnessed a marginal increase from ₹33,921 crore in April to ₹35,189 crore in July in terms of value. The volume of transactions in the category rose from 55.22 crore in April to 61.249 crore in July.
Telecom services that are powering the backbone of UPI transactions in the country also witnessed an increase from ₹19,323.48 crore in April to ₹21,629 crore in July. The volume of telecom services-related transactions, like data recharge, bill payments, etc., surged from 85.714 crore in April to 87.188 crore in July.


NPCI’s data also revealed the increasing usage of UPI for utilities-related transactions like electricity, gas, water, and sanitation, which increased from ₹18,060.74 crore in April to ₹23,497.63 crore in July. The volume of transactions increased from 16.221 crore in April to 17.472 crore in July.
The overall transactions made via UPI in terms of value jumped from ₹6,63,561.79 crore in April to ₹7,34,012.36 crore in July.