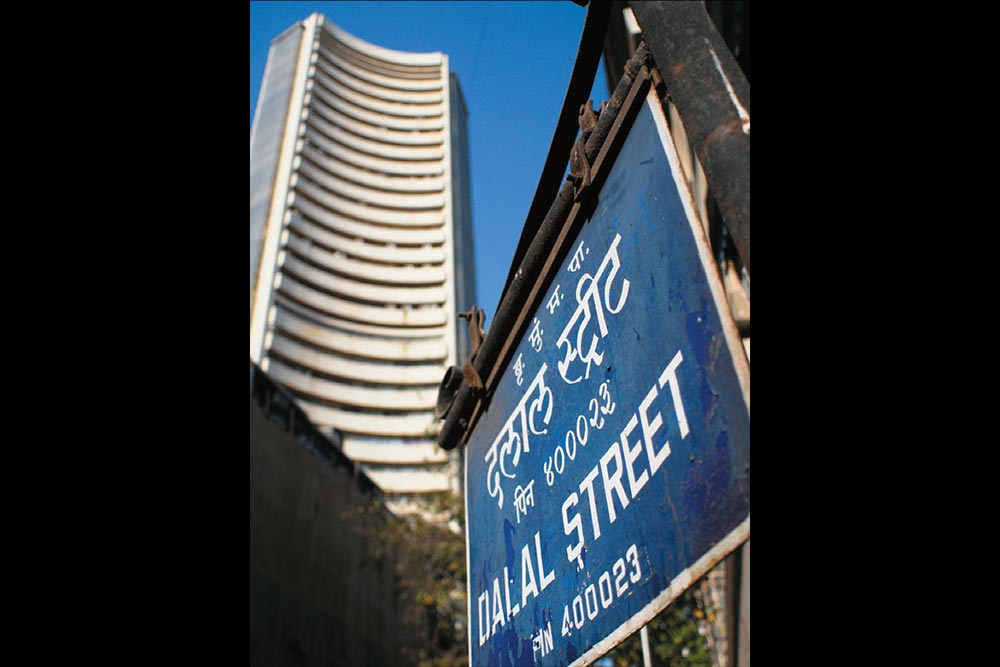
The reaction of a widely-read pink paper, when it screamed “Band, Baaja, Bernanke!” to capture the 600-point rally in the Sensex, following the US Federal Reserve’s decision to continue with the stimulus package, seemed to suggest the worst was over for Indian equities. But after hitting a three-year closing high of 20,647 on September 19, the euphoria didn’t last for long as the benchmark fell 700 points (4%) to 19,920 on September 24. The slide was largely on account of a surprise hike in the repo rate by the new Reserve Bank of India governor, Raghuram Rajan, who continued the hardline approach taken by his predecessor towards combating stubborn inflation.
Also, with GDP growth in FY13 dropping sharply to 5%, the lowest since FY03, and Q1FY14 growth, too, falling to 4.4%, marking three consecutive quarters of sub-5% growth, the outlook for the markets seems far from rosy. Already, net sales growth for the Sensex constituents has decelerated in the first quarter of the current fiscal to 1.7% y-o-y — the lowest since the global financial crisis in 2008 — and is a confirmation that the numbers in the coming quarters will only look worse.
Not surprisingly, the 30-share Sensex has shown largely flat return at 1.73% YTD, while the mid-cap index is down 23% for the same period. Similarly, the 50-share Nifty is down 1% and the CNX mid-cap is down 19%.
But, interestingly, the disparity between the two indices is not as stark when it comes to valuation gap (see: Picture in contrast). According to Gautam Trivedi, MD and head of equities, India, Religare Capital Markets, “There is currently no appetite for mid caps and the disconnect visible in the charts is largely because some heavyweight stocks in the mid-cap index are enjoying a higher valuation multiple.” And that’s true. If one were to exclude big names such as RCom, Godrej Consumer Products and Adani Enterprises, which are currently trading at higher multiples of 28-35 times one-year forward earnings, the picture would look very different.
Concurring with Trivedi is Manish Bhandari, managing partner and CEO, Vallum Capital Advisors, who believes price-to-book multiple (P/BV) is the best way to capture the market’s outlook towards large and mid caps. “PE [price to earnings] is not influenced by distribution of dividend, as dividend is after tax, whereas P/BV is influenced by how much dividend is paid since book value is all about retained earnings.” Indeed, the P/BV chart clearly shows the gap.
Going ahead, the consensus on the Street is that with markets expected to stay volatile in the near future, there will be a polarisation towards larger caps. “Given the current environment, I see a further downside in the markets by 10% and, that being the case, mid caps could get a further drubbing,” adds Trivedi.


